Understanding Training Zones 1
As a busy summer comes to an end after working with many runners and Triathletes, I thought I’d touch on a subject that often confuses runners / athletes, even some quite experienced ones; Training Zones, sometimes referred to as Heart Rate Zones. Part of the confusion stems from online sources relating their use of zones without clarifying how those zones were established and in what training context they are using them. So if you’ve heard of training zones or possibly heart rate zones (the same thing) but you’re not quite clear on what they are and how to use them, I hope to clear things up a little. In this post I’ll focus on how zones are arrived at and in follow up posts I’ll look at how to use them and some possible pitfalls.
Here’s the short version to create some context. When we exercise our bodies derive energy from various sources, which sources we use will vary from person to person, depending upon their level of training, their diet and the level of exertion that they are undertaking in a given training session. Human bodies have two primary energy substrates; fat and glucose. There are also two secondary substrates; lactate and ketones. Our focus will be on fat, glucose and lactate.
Three Metabolic Processes
When we exercise at a gentle easy going level of exertion our bodies will preferentially access fat to create energy, this fat metabolism is entirely aerobic in nature it takes place within the Mitochondria, as exertion levels increase the body will start to access increasing levels of glucose also primarily aerobically also within the Mitochondria and if exertion continues to increase fat metabolism decreases noticeably and glucose metabolism increases and much of the metabolism is carried out anaerobically, outside of the Mitochondria. How efficiently the body accesses and utilises energy sources is one of the primary objectives of training. To effectively train any process within the body you need to progressively stress the body to carry out that process. Targeting these various processes with some degree of accuracy will bring the best and most sustainable results safely. It should be understood that although the body will prioritise one energy source over another, dependant upon effort there is always a mixture of the three metabolic processes, outlined above, taking place.
I’ve already thrown some terminology at you so I think the best place to go to next is a little clarification over the main terminology.
Terminology
Lactate: This is a chemical byproduct (contrary to what you might have heard it is not a waste product), that is created when the body breaks down glucose/ sugar to produce energy. More on this later.
Lactate Threshold (LT): These are chemical markers of the amount of Lactate circulating in the blood. These levels have to be measured by taking small samples of blood during exercise. Two specific points of changes in Lactate levels are looked for, these are called LT1 and LT2.
Ventilatory Thresholds (VT): These represent observable changes in breathing intensity that broadly reflect some of the stages of changes in Lactate Thresholds, usually. These are labelled VT1 and VT2.
Mitochondria: These are tiny ‘organelles’ that are located in most cells of the body, they are highly profuse in slow twitch muscles and much less so in fast twitch muscles. Mitochondria are often referred to as the ‘power plant of the cell’ because they generate energy the cell needs to function.
Aerobic Metabolism: This refers to how mitochondria utilise fat or glucose in combination with oxygen to generate energy within the Mitochondria Organelle.
Anaerobic Metabolism: This is the process by which the body makes energy by metabolising glucose outside the Mitochondria without Oxygen. This is done when the body is exerting itself to a high level either by moving at high speed or moving relatively heavy weight.
So with that little bit of background knowledge let’s look at ‘Zones’. First of all it has to be understood that there are two fundamental types of ‘Zones’: Physiological and Training.
Physiological Zones
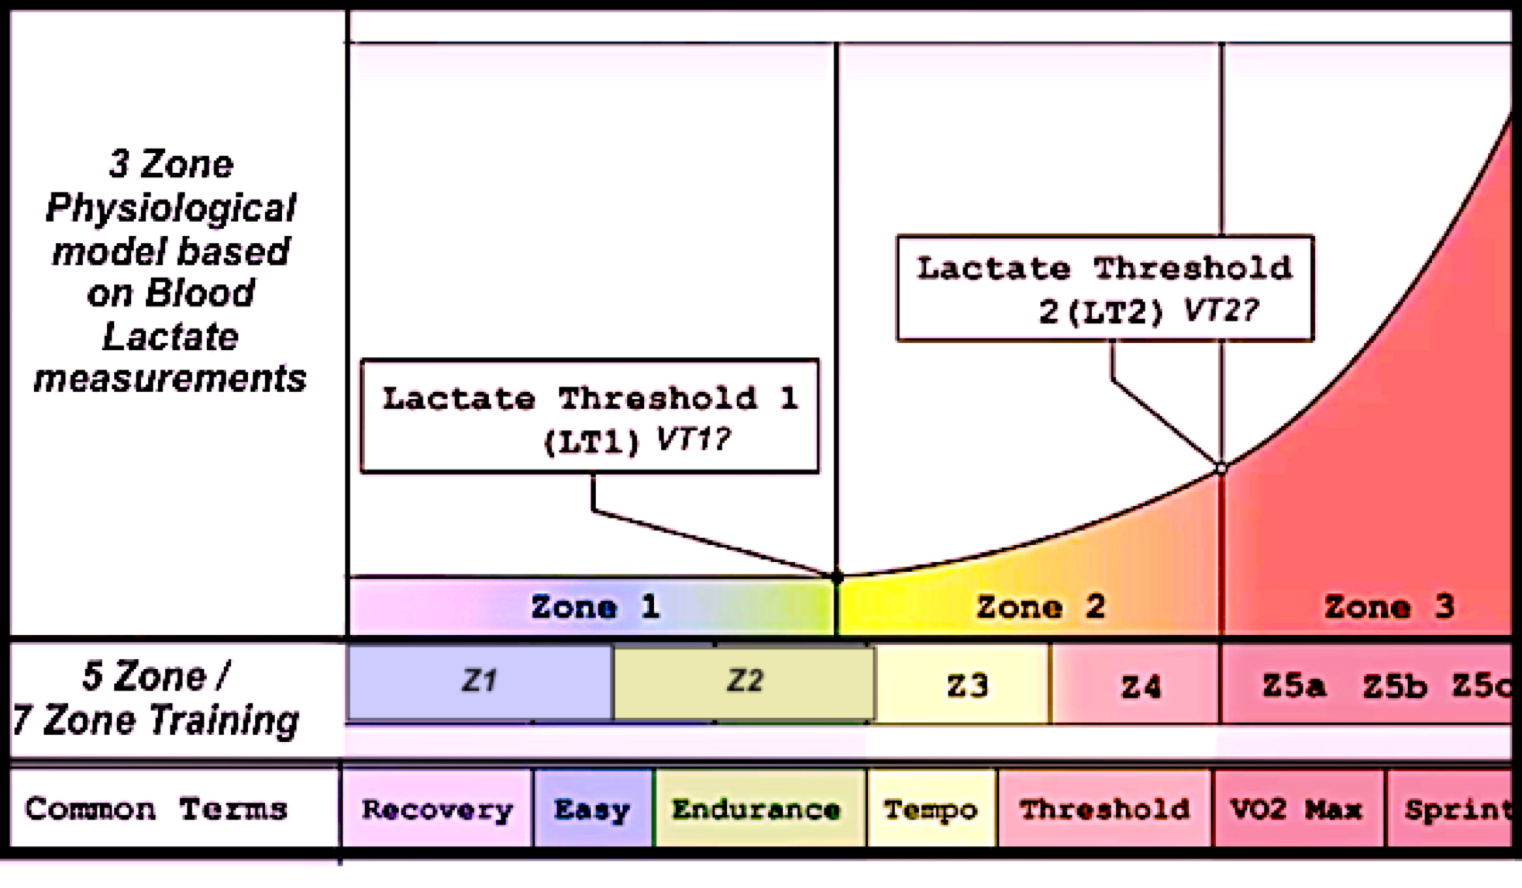
Physiological Zones are; real, measurable and demonstrable. Training Zones, on the other hand, are created by athletes and coaches often using levels of exertion (heart rate or perception) overlaid on the Physiological Zones. The diagram below shows the Physiological Zones at the top, as you can see there are just three of them. The Physiological Zones of each individual are best established by measuring blood lactate, during a progressive effort training session. A blood lactate test will show one of three states; 1) blood lactate is low and stable. 2) blood lactate is slowly increasing but the body is able to manage the level produced. and 3) blood lactate is increasing rapidly and the body can no longer clear it from the blood. The increase in Blood Lactate reflects the level of aerobic to anaerobic metabolism that is taking place within the body as a whole. The more glucose that is metabolised the higher the Blood Lactate level. The use of actual measurements of Blood Lactate make these zones objective and measurable. It is important to note that the blood sample is obtained from a peripheral point on the body (ear lobe or finger tip), so it is a measure of total body Lactate not the lactate within a specific working muscle, this has important implications when training in extreme temperatures.
Training Zones
Training Zones as stated above are derived from Physiological Zones, however the precise division of the zones varies from coach to coach. Some coaches simply use a close approximation of the Physiological Zones (i.e. three zones), the most common Zone pattern is five Zones, some coaches use as many as seven zones, this number of zones is intended to allow very precise management of the athlete’s exertion level. However this fine division of effort is only valid if a high degree of Blood Lactate testing is carried out. In the diagram above the 5-7 Training Zones are placed below the Physiological Zones showing their approximate equivalences.
Training Zones are most commonly marked or judged according to heart rate or the athletes perception of exertion. This makes most Training Zones somewhat subjective and harder to be sure of their accuracy. Professional athletes often test their Lactate routinely as a part of their regular training, enthusiasts are now often able to access a sports physiology lab and get their Lactate Thresholds measured periodically and use those results to calibrate their training zones. For those interested in accessing a sports lab for a Blood Lactate test, a word of caution. Labs often advertise three different types of test; a Blood Lactate Test, a VO2 Max Test and a ‘bargain’ combined test where both Lactate and VO2 Max is measured in one session. The problem with the combined test is that in order to get a meaningful VO2 Max test the ramp up of speed through the lower levels of exertion are often too quick. This results in the Lactate reading lagging behind the physiological reality, this is because Lactate takes a little time to build up at any given level of exertion. This can result in the speed of the test increasing before the lactate has built up in response to the previous speed this risks making the result less useful.
Using the five zone system as an example, zones one and two will usually reflect the initial zone in the Physiological Zone chart illustrated above. This should reflect exercise at an easy effort, everything from a steady walk up to a steady run (depending upon fitness). Training Zones three and four reflect the middle area of the Physiological Zones, effort is increasing and as it increases the sustainability (duration) of the training session reduces. Zone five reflects the last part of the Physiological Zones, Blood Lactate is increasing rapidly and the effort is only sustainable for a matter of minutes for most people.
The Zone systems that use more than five zones usually divide the fifth zone into smaller sub divisions, so for example this might indicate Zone 5 being a very high level of exertion, but one that can be recovered from if it isn’t maintained for too long, as might be used in an overtaking manoeuvre or hill sprint in a cycle race, whereas Zone 6 or 7 might be an all out effort such as a sprint to the finish line, or possibly viewed as a purely training effort, rarely to be used in competition. A brief aside, I mentioned cycling above rather than running because the use of 6-7 zones is far more common in cycling than running. It should also be noted that the zones are different for the same athlete if they train both cycling and running. This is because of the different loads and muscle recruitment patterns that occur between the different activities.
In the chart above you’ll note that I put a ‘?’ next to the ‘VT1 / VT2’ markers, this is because these are approximate equivalencies with LT1 and LT2. While it is generally agreed that there is a strong correlation between VT1 and LT1, there is less certainty over the VT2 / LT2 equivalence.
We’ll look at using the training zones in a future post.
#personaltrainer #couchto5k #trainingzones #heartratezones #healthandfitness #startrunning